Here Is How I Drilled Down To Get A Sweet Energy Rate
Don’t just renew with your current energy company before shopping around first. My contract was due to end this month, and I didn’t expect to find any deals what with all the energy issues Texas seems to have… but I was wrong.
Here are some quick tips that might save you some time and hassle.
1. Login in your current energy provider and a) write down the price you paid each month and b) the corresponding kWh you utilized. Notice what your most common kWh range is. Do you use closer to 500, 1000, or 2000? This will come in handy when comparing prices.
2. Go to www.powertochoose.org (there is also a .com website with the same name, so be aware of that scam) and type in your zip code for offers in your area. There are currently 145 options for the 75901 Lufkin zip code.
3. Filter by what matters matters most for your specific needs. I found the filter for the “estimated use” to be most beneficial because some plans had a low price per kWh if you use 1,000 kwh; however, when you dip below that the price would increase significantly.
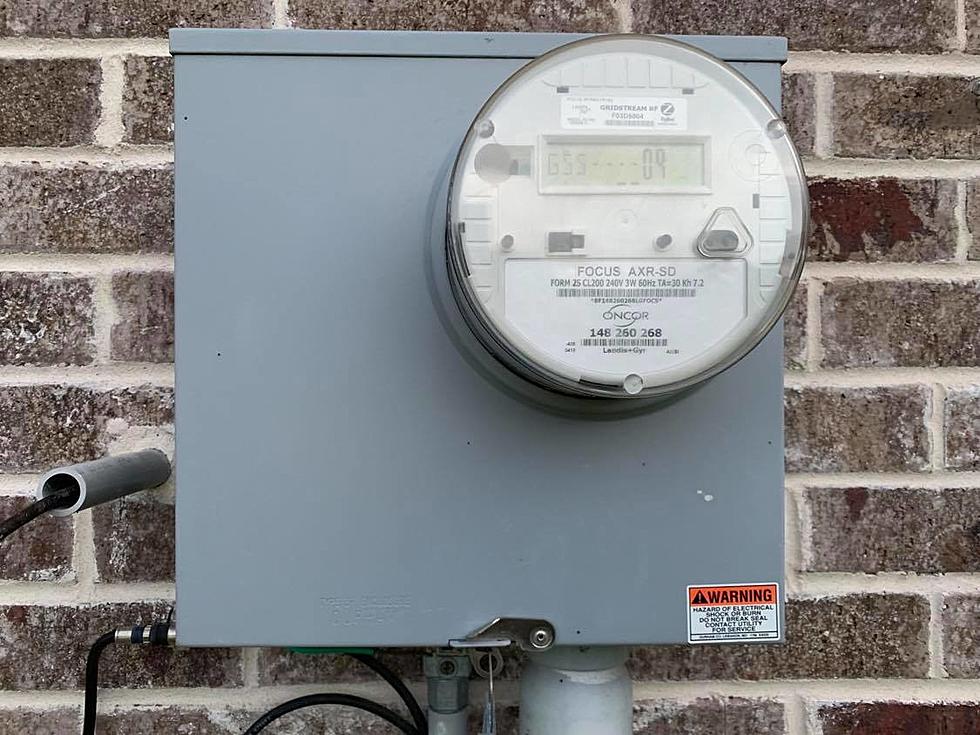
4. Read the fine print. Does the price per kWh include the Oncor electric delivery. You could see this as the abbreviation “TDU”. The Fact Sheet will tell you this along with the length of the contract they are offering, as well as any early cancellation fees.
5. Once you find out what the total average price per kWh hour will be for the plan you are interested in, multiply that number by the kWh usage you had for a handful of months last year (the numbers you wrote down in step one) and see how it compares to what you actually paid. If it’s lower, then that plan is a contender.
When I was done, I got quoted an average of 9.7 cents per 500 kWh, and 9.3 cents per 1,000 kWh. That was better than the 11.25 cents per kWh I was getting before. Of that 9.7 cents per kWh, only 5.4 cents is the base. The remaining amount was the TDU charges.
Happy energy shopping.
LOOK: The most expensive weather and climate disasters in recent decades
LOOK: Here is the richest town in each state
More From Newstalk 860